
In today’s digital age, having a strong online presence is table stakes if you want your B2B business to succeed. But having a website isn’t enough to guarantee your success. To truly thrive, you must measure your B2B website metrics consistently to track performance and guide your strategic decisions.
Having a website without visibility into its performance is like driving your car blindfolded. Just like being unable to see the road ahead or monitor speed is dangerous and can lead to an accident, not measuring a website’s performance can lead to poor user experience and low conversion rates.
And, with B2B buyers turning to online channels to make purchasing decisions more frequently than ever before, a failing website often equals a failing business.

Tracking website metrics regularly provides valuable insights into user behaviour, areas for improvement, and opportunities to optimize website performance to ensure that it’s meeting business objectives.
On the other hand, not analyzing the metrics consistently makes it difficult to know what parts need attention, and you can’t improve what you don’t know!
There are so many website metrics available to track and monitor. But, not every metric is worth monitoring or will lead to informed data-driven decisions that result in improved engagement and increased leads.
Let’s take a closer look at the website metrics that will help you get closer to your business goals.
The B2B Website Metrics That Matter the Most

With so many B2B website metrics available for you to track and analyze, the abundance of data can be overwhelming.
But, as we said, not all data carries equal significance.
Contrary to popular belief, your bounce rate and page views are not the ultimate measure of your website’s success!
There are metrics that hold greater importance, and failing to keep track of them means missing out on valuable opportunities to enhance website performance and ranking and make informed decisions to reach marketing goals.
So without further ado, here are the must-watch B2B website metrics that actually matter for your business.
1. Channels & Channel Groupings
Marketing channels are like roads that guide visitors to a website. Like how roads connect different locations and help people reach their desired destinations, marketing channels connect potential customers to a website.
Without regular road maintenance, there won’t be a smooth traffic flow. In the same way, marketing channels require ongoing maintenance and optimization to ensure that they drive traffic to a website effectively.
Keeping an eye on how visitors reach a website and monitoring marketing channel metrics will uncover how different marketing campaigns are performing across different channels and where there is greater engagement or potential room for improvement.
The default marketing channels to monitor include:
- Organic Search (e.g. traffic from search engines)
- Social (e.g from your Facebook posts)
- Display (e.g. from LinkedIn ad campaigns)
- Paid Search (e.g. from Google Ads campaigns)
- Direct (e.g. when someone types in your site URL directly)
- Organic Shopping (e.g. from Google Shopping)
When examining your marketing channels, pay attention to the session growth, user growth, and conversion rates (see below), both year over year and period over period. It’s a good idea to benchmark these metrics against your own site to measure your growth over time.

Reviewing website traffic from different marketing channels (marketing mix) is one of our favourite and default starting points when we evaluate website metrics because it provides a bird’s eye view of how marketing campaigns are fairing in bringing traffic to a site and driving overall growth and engagement.
For example, if most of your traffic comes from paid search but hardly any comes from organic search, it may be time to improve your search engine optimization strategy to attract more organic traffic and improve your site’s organic ranking.
But, be sure to look at your marketing channel metrics in conjunction with the other metrics we mention below as you’ll want to see what channels, in particular, are attracting more traffic, which pages are driving more engagement, and ultimately leading to more conversions.
Where to Find it
You’ll find the website traffic by channel in GA4 in the Acquisition Reports.
2. Top Landing Pages
Knowing where your users start their journey on your site can help you understand their experience and unlock the secrets to conversion rate optimization.
When examining top landing pages, i.e. those that attract the most traffic, it’s important to understand which pages drive more traffic and which are underperforming. Then it’s possible to assess which pages must be optimized to attract more relevant traffic.
Doing this allows for necessary changes to improve the effectiveness of certain landing pages to attract more relevant traffic and improve search rankings.
Your homepage might not be the primary way users begin their journey on your site, and that’s a good thing–it means your other inbound and content marketing methods are working!
Keeping high-performing pages updated and optimizing underperforming ones improves overall website performance, increases engagement and conversions, and ultimately drives more business success.
Where to Find it
You can find your top landing page report in GA4. On the navigation sidebar on the left side of your screen, go to Home > Reports > Engagement > Landing Page Report.
3. Conversion Metrics
Conversion rates are a vital metric for measuring the success of your marketing efforts.
By tracking the percentage of users who take a desired action (such as making a purchase or filling out a contact form), you can determine the effectiveness of your marketing campaigns in driving conversions.
The conversions you should track will vary based on your business type and goals.
For example, if you’re a B2B e-commerce company, tracking actual sales (revenue) and transactions as conversions is critical.
However, other B2B businesses may focus more on lead generation (sales inquiries, webinar attendance, demo requests, etc).
Whether it’s an actual sale or another activity that results in the user entering your sales pipeline, these actions should be considered for conversion tracking purposes.
Comparing conversion rates year over year and period over period can help identify areas for improvement to achieve better results in a marketing strategy.
Pro tip: Be cautious about what interactions you track as a “conversion”. For example, we’ve seen some businesses track all form submissions as conversions even when not all form submissions are lead generation. A user submitting a “help/support request” form could indicate a current customer, not a potential one. Likewise, most “newsletter” signups wouldn’t be classified as a conversion unless your business treats these as leads and works them in your sales process. We’d recommend classifying those as “events” instead.
Where to Find it
In a standard GA4 report, you’ll find your conversion metrics by going to Reports > Engagement > Conversions Report.
4. Device Type

Tracking the device type metrics for your B2B website is crucial in today’s mobile-driven world.
With the proliferation of smartphones and tablets, more and more users are accessing websites from their mobile devices.
However, it’s important to note that mobile devices are not the only means visitors can access your website. Depending on your industry and business, desktops may be more prevalent, making it vital to understand the device mix of your audience to make informed website design and development decisions to optimize your site for the relevant devices.
It’s also crucial to consider device-type metrics in conjunction with other metrics. For instance, negative conversion rates associated with a specific device type may indicate issues with a website, such as technical problems with the mobile site.
Where to Find it
To find your device type metrics in GA4, go to the Tech section > Reports. You will see a breakdown of users by platform, device category, operating system, screen resolution and more.
5. Traffic by Content Type
Measuring your B2B website traffic by content type is another essential metric you should track.
When examining content type metrics, we prefer to categorize content by “page type” or analyze them alongside the sales funnel, which includes Top of Funnel, Middle of Funnel, and Bottom of Funnel, and distinguish content according to the different stages that your audience may be in their buyer’s journey.
Having different content types that speak to each funnel stage is best practice. A good balance of the different types of content and a commitment to analyzing the contant in each stage regularly will help keep your funnel flowing smoothly.
Pro Tip: Keep an eye out for “hidden sales killers”. For example, focusing too much on TOFU content can cause oversight of MOFU content. While you may keep seeing your SEO traffic increase, it may not translate to increased leads. Increased TOFU SEO traffic could mask a decrease in MOFU SEO traffic that typically supplied most of your lead gen.
Where to Find it
In GA4, you can create content groups to categorize pages and screens into custom buckets, which allow you to see metrics for related groups of information. For example, you can create a bucket for pages that are MOFU content and another for pages that are TOFU content.
6. Keyword Rankings
Search Engine Optimization (SEO) is hands-down one of the most fruitful ROI drivers we’ve seen for B2B businesses.
However, the traditional channel metrics in Google Analytics related to organic search often fall short.
Why? Because it doesn’t distinguish between branded and non-branded searches.
Ranking for branded terms on search engines is as easy as stealing candy from a baby.
But let’s be real; the non-branded ones are where the real benefit lies.
That’s why it’s crucial to keep a close eye on what keywords you’re ranking for, how they’re trending, and how much traffic they’re driving–especially for those “money terms”.
Money terms are the ones most likely to drive leads and transactions. And while they don’t necessarily have to be high volume, they do have to be a good fit. For example, if you are a managed cloud services company, a key money term for your business could be “managed cloud services”, which will likely attract users looking for your type of services specifically.
Where to Find it
You can find your keywords or search queries people are using to find you in Google Search Console. In the dashboard, navigate to Performance > Search Results. Within this report, you will see queries and pages, where you can sort by clicks and impressions.
7. Core Web Vitals
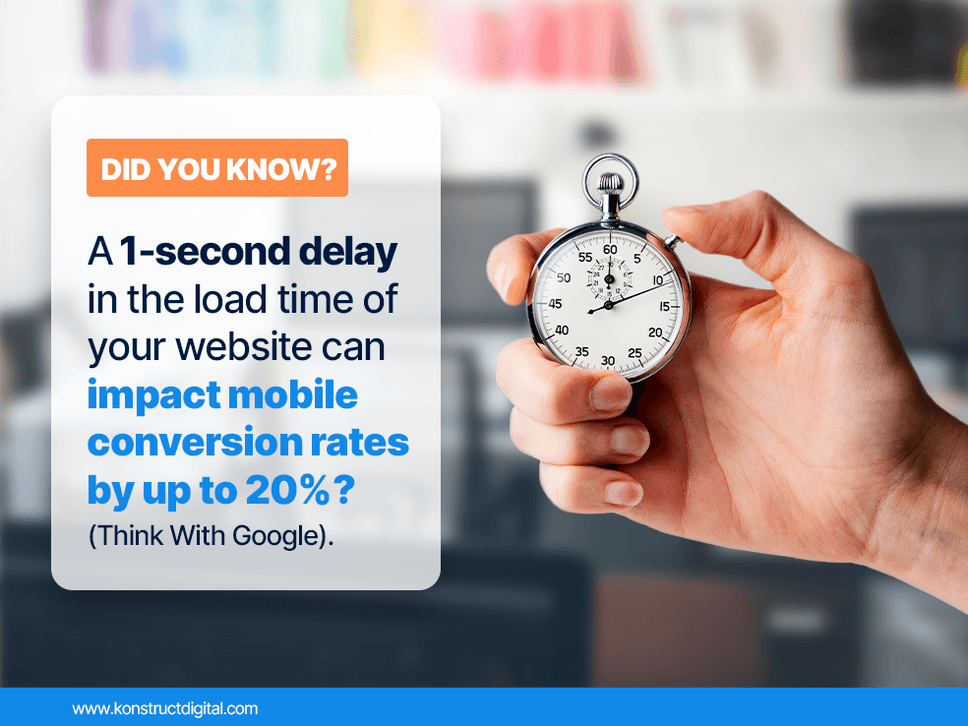
The speed at which your website loads and how it performs can significantly impact the user experience and conversion rates of your site.
It’s a no-brainer then that it’s essential to keep websites in tip-top shape for optimal performance and user experience to keep audiences right where you want them…staying on your site!
So how do you measure this? By looking at your core web vitals (CWV)!
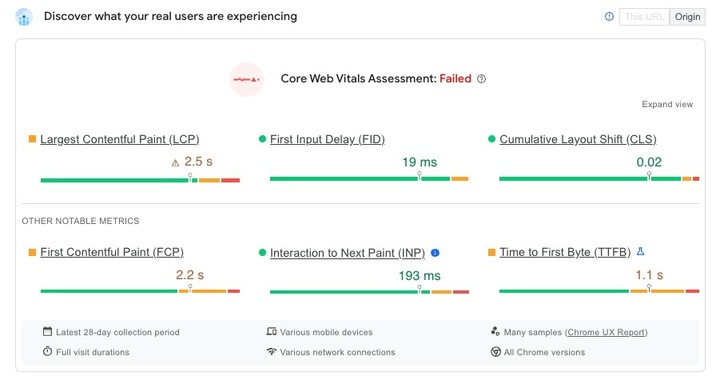
Core web vitals represent the overall user experience of a website, like page load speed, mobile-friendliness, user interaction, and visual stability.
Core web vitals include
- Largest Contentful Paint (LCP), which represents the speed at which the main content of a web page is loaded and should ideally be under 2.5 seconds.
- First Input Delay (FID), which measures the responsiveness of a page to user interactions. The delay before a user can interact should ideally be under 100 milliseconds.
- Cumulative Layout Shift (CLS), which measures the visual stability of content on a page during loading and should ideally be less than 0.1.
The different criteria are measured on a scale of good, needs improvement, or poor, providing you with insights into any UX issues which may need to be addressed.
Do you know why it’s important to check up on core web vitals regularly?
Healthy core web vitals:
- Ensure a positive user experience
- Provide improved visibility
- Promote favourable rankings on search engines
Where to Find it
You can find your core web vitals in the Google PageSpeed Insights tool. See the example below:
The Nice-To-Know (but Not Essential) B2B Website Metrics
Now for the not-so-important metrics. Although the below metrics are important to some extent, they are not the ultimate factors to consider when assessing the performance and success of a website.
1. Bounce Rate
You’ve seen it on every other blog post–how bounce rate is one of the most important metrics to monitor. But, we are here to shatter that myth.
Bounce rate is one of the most over-rated and misunderstood metrics!
Why?
Because bounce rates are easily manipulated, which makes external benchmarking inaccurate.
In Google Analytics (Universal Analytics), for example, you could set it up to track scroll events so that even though a user may have only scrolled 50% of a single page and left, it would not count as a bounce. Whereas on a site without scroll tracking, it would count as a bounce.
When it comes to analyzing your bounce rate, it’s most important to benchmark against yourself and analyze how your own site is improving over time.
We recommend looking at the trend on a per-channel basis over time. Your direct traffic is likely to be the most stable, so if you see improvements here, it’s most likely to be accurate.
The best success we’ve seen in maintaining a healthy bounce rate is ensuring your page matches the intent of the user or what their expectations might be.
For example, if a user’s search query is informational in nature, but they’re directed to a more service or product-oriented landing page, that mismatch in intent is more likely to cause a bounce.
Pro Tip: Whether you’re tracking bounce rate or engaged sessions, it’s important to look at the metrics by channel source to understand which of your channels drive higher engagement.
For example, if you dramatically increase display ad exposure for your site, you’d typically find that traffic from ads often has a higher bounce rate and lower engagement rate. The average bounce rate on your site would then appear worse.
Where to Find it
You can find your bounce rate in GA4 by navigating to Behavior > Site Content > Landing Pages report.
2. Pages Per Session
Pages per session is a metric of how much content a user consumes on your site within a single visit.
It’s helpful to watch this metric to ensure you’re attracting the right audience to your site. If the pages per session metric is high, it indicates that visitors are finding your site engaging, relevant, and interesting enough to explore further.
But again, pages per session is a nice-to-know metric rather than a must-know!
Generally, two pages per session is an acceptable number for a B2B website, but as with your bounce rate, you should benchmark your pages per session metrics against yourself to see how your website improves over time.
Like bounce rate, it’s important to ensure landing pages match the user’s intent so that the user sticks around in the first place. Then, ensure the page is well-optimized to provide users with additional related content and resources to keep them engaged and wanting to continue their journey through the site.
Where to Find it
To find your pages per session in GA4, go to Reports > Engagement > Pages and Screens, and view your Views Per User.
Average Session Duration
The average time spent on your website is going to be largely dependent on a few factors:
- What the user is looking for
- How well your content aligns with the user’s intent
- The channel source (e.g. organic search tends to result in higher session durations because users are actively searching for information compared to someone interrupted by a display ad, on average).
See below for an example breakdown of average session duration under the “Average engagement time per session”.
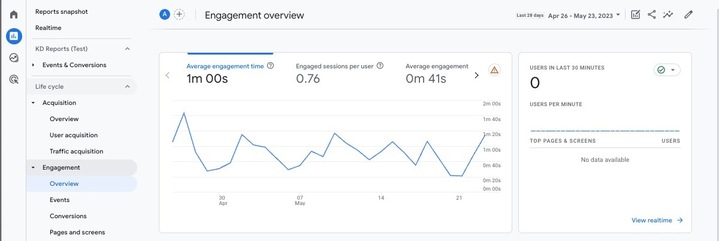
Remember that Universal Analytics (UA) and GA4 measure the average session duration differently.
With GA4, session duration is only tracking engagement time that occurs in the foreground (i.e. the user has to have the page visible and active on the screen). It does not include time spent on other apps or websites while the website or app is running in the background. On average, we’re seeing GA4’s average session duration to be less than that of UA.
Where to Find it
To find your average session duration metrics in GA4, go to Reports > Engagement > Overview.
New Vs Returning Users
For most B2B business websites, we’d argue that measuring new vs returning visitors is a fairly unimportant metric to track and place it more in the “interesting to know, but you’re probably not ever going to do anything with it” category.
Sales cycles for B2B businesses are typically longer and more complex than for B2C, and the focus of B2B websites is often on building long-term relationships with other businesses, rather than attracting many one-time customers.
As a result, the number of new visitors to your B2B website is less important than the quality of those visitors and the depth of the relationship with existing customers.
The only caveat to that would be if your B2B business is building a community where your website is a hub of activity, or if you’re tracking the analytics of your app/software. In that case, having a high percentage of repeat visitors and users returning frequently is critical.
New vs returning visitors metrics are influenced more by your business model than anything else. For example, for most non-SaaS, non-e-commerce B2B business websites, new visitor rates will likely be low, and return visitor rates will be in the 70%+ range.
Where to Find it
To find new vs. returning user metrics in GA4, go to Reports > Acquisitions> Overview. Then select a date range to see the number of unique users in the specified date range.
How Konstruct Can Help Maximize the Key B2B Website Metrics for Your Business
Navigating your way around your B2B website metrics may feel like trying to work your way through a maze blindfolded–it takes skill, practice, and some fancy navigation tools.
If you’re feeling overwhelmed about where to begin, Konstruct Digital can help!
We have a marketing team of experts and an arsenal of cutting-edge tools to accurately measure and analyze your website metrics. We’ll provide expert insights to help you make data-driven decisions to improve your website’s performance, enhance user experience, and ultimately drive more quality leads and sales to your business.
So, if you want to take your B2B marketing to the next level, partnering with us to keep track of your website metrics is a no-brainer.
Let’s discuss your B2B website metrics and see where we can help you improve your website’s performance. Get your proposal today!
Need help with B2B Digital Marketing?
Learn more about Konstruct's B2B Digital Marketing Services
More B2B Digital Marketing Resources
- B2B Manufacturing Marketing That Actually Works in 2025
- Proving Marketing’s Value in 2025 for B2B
- Perform This 1 Exercise to Increase Your Close Rates and Drive Revenue Lift
- Should You Be Doing CRO for Your B2B Website?
- How to Set Your Marketing Agency Up for Early Success
- Your B2B Go-to-Market Strategy Is Failing: 10 Red Flags You Can’t Ignore
- The *Definitive* 8 Best Manufacturing Marketing Agencies in North America [2025 Edition]
- Don’t Panic: How to Diagnose Dropping B2B Marketing Metrics
- The Top 3 Digital Marketing Opportunities for Manufacturers in 2025
- Konstruct Ranks on Top Growing Companies List for 2nd Year in a Row